D3js畫的折線圖 #4 補個提示資訊框
最後,我們加個提示框
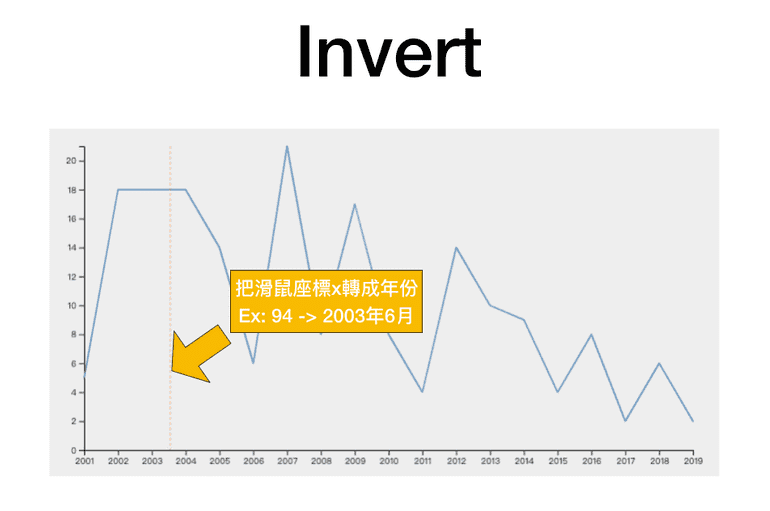
invert
let x = d3
  .scaleLinear()
  .domain([0, 10])
  .range([0, 1000])
console.log(x(10))
console.log(x.invert(1000))
d3-bisect
Array bisection algorithm
The default d3.bisect uses the d3.bisectRight strategy.
d3-bisector
const dataset = [1, 2, 3, 4]
const target1 = 2.5
const target2 = 0
const bisectDate = d3.bisector(d => d).left
// (a, x, lo, hi) 最小值是1,如果比這個數值還小,就回傳1
let index = bisectDate(dataset, target2, 1)
console.log(index)
d3.call
tooltip.call(drawTooltip, [
  `${d3.timeFormat("%Y")(closerData.year)}`,
  `全壘打:${closerData.homerun}`,
])
等同
drawTooltip(tooltip, [
  `${d3.timeFormat("%Y")(closerData.year)}`,
  `全壘打:${closerData.homerun}`,
])使用call的方式,就可以搭配chain的方式使用
getBBox
SVGGraphicsElement.getBBox() Returns a DOMRect representing the computed bounding box of the current element.
2020-04-04 更新
raise
影片11:30的地方,因為後面畫的框框會把前面先畫的文字蓋掉
那時不知道怎麼把文字提上來,是使用groupElement.selectAll("text.tooltip-text").remove()先把文字部分移除再重畫
最近發現.raise()的方法,可以做到這件事,真是太棒了
看了 source code,是使用this.parentNode.appendChild(this)
所以也可以寫這樣:
groupElement.selectAll < Element,
  any >
    "text.tooltip-text".each(function() {
      this?.parentNode?.appendChild(this)
    })
Share


